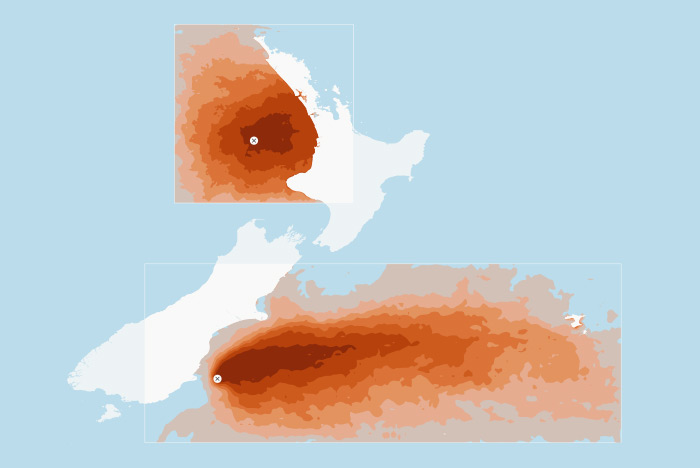
Loading map...
Drilling rights in the ocean surrounding New Zealand are being sold off to big oil companies. Texan oil company Anadarko is set to begin deep sea exploratory drilling this summer off our coasts.
Exploratory drilling is the most dangerous part of oil production and adding the challenges of drilling in very deep water compounds the risks.
A spill from a deep water well could result in oil flowing freely into the ocean for many weeks.
Loading data...
The probability map shows the likelihood that a particular area will be impacted by more than 1g/m2 of oil. This threshold is the amount of oil that would require a beach clean up.
In summer, the west coast beaches around the Manukau Harbour are likely to be affected first. In the worst case scenarios (a probability of 5%) beach cleanups may be required just two weeks after the blowout.
Fortunately, in this scenario an uncontracted relief rig capable of drilling in deep water was available on Australia's North West Shelf. After the long journey to New Zealand it has finally reached the drill site.
The complicated task of drilling into the damaged well to perform the necessary kill operations and stop the blowout can now begin.
The probability map shows the likelihood that a particular area will be impacted by more than 1g/m2 of oil. This threshold is the amount of oil that would require a beach clean up.
In the worst case scenarios (a probability of 5%), Oamaru's local peguins may not only have to contend with a dangerous oil slick out at sea, but oil may also wash up on the beaches where they come ashore each evening.
After just 6 weeks, at least 35% of the modelled spills have impacted all west coast beaches from Kaipara Harbour to Raglan.
For some beaches around the Manukau Harbour entrance, the likelihood of oil being present is even higher than this (50% probability).
Tourists flock to the coastal town of Kaikoura to see sperm whales. However, after 10 weeks, a vast area of their preferred habitat off the Eastern coast of the South Island could be impacted by the oil spill. In the worst case scenarios (probability 5%), even the beaches of Kaikoura will need to have oil cleaned from them.
Despite hundreds of kilometers separating the Chatham Islands from the site of the blowout, a spill could impact these islands. After three months, the worst hit parts of the Chatham's have a 35% probability of oil affecting the shoreline.
Combined with the impacts on the prime oceanic foraging grounds of the Chatham Rise, a spill could have disastruous consequences for the unique seabird and marine life of these islands.
Although the blowout was stopped over a month ago, oil will very likely continue to drift across the ocean and wash up on the coast. Sadly, this is not the end of the disaster, as the effects of the spill will likely endure for years to come.
To see and read more about the potential impacts, explore the layers and locations tabs. Discover more about deep sea drilling and the science behind the probability maps in the LEARN and THE SCIENCE sections
NIWA, 20 years of Chatham Rise fish surveys
MPI, Fishery - Hoki (including key bycatch stocks)
Alfaro et al., 2011: Green-lipped Mussels in GLM 9. New Zealand Fisheries Assessment Report 2011/48.
Aquaculture New Zealand
Alfaro et al., 2011: Green-lipped Mussels in GLM 9. New Zealand Fisheries Assessment Report 2011/48.
DOC, Hector's dolphin
IUCN, Cephalorhynchus hectori
Twelve of the world's albatrosses breed in New Zealand. Albatrosses spend 85% of their lives at sea, travelling thousands of kilometres in a single year.
These majestic birds will travel immense distances from their breeding colonies to find food far out at sea. Birds from the Subantarictic Islands, Chatham Islands and Taiaroa Head will forage along the productive waters of the Subtropical convergence and Chatham Rise. The points on the map represent breeding colonies for three albatross species:
DOC, Albatrosses
DOC, Yellow-eyed penguin/hoiho
Yellow-eyed Penguin Trust
Distance from well site: 270 km
Download the report for a full oiling analysis for Hokianga Harbour and learn about the impact thresholds here: The Science
Distance from well site: 210 km
Download the report for a full oiling analysis for Kaipara Harbour and learn about the impact thresholds here: The Science
DOC, Facts about New Zealand fairy tern/tara-iti
Integrated Kaipara Harbour Management Group
Kelly, 2008. Environmental condition and values of Manukau Harbour. Prepared by Coast and Catchment Ltd. for Auckland Regional Council. Auckland.
Distance from well site: 180 km
Download the report for a full oiling analysis for Piha & Muriwai and learn about the impact thresholds here: The Science
Distance from well site: 180 km
Download the report for a full oiling analysis for Manukau Harbour and learn about the impact thresholds here: The Science
Kelly, 2008. Environmental condition and values of Manukau Harbour. Prepared by Coast and Catchment Ltd. for Auckland Regional Council. Auckland.
Distance from well site: 180 km
Download the report for a full oiling analysis for Manu Bay, Raglan and learn about the impact thresholds here: The Science
Distance from well site: 170 km
Download the report for a full oiling analysis for New Plymouth and learn about the impact thresholds here: The Science
Distance from well site: 420 km
Download the report for a full oiling analysis for Kaikoura and learn about the impact thresholds here: The Science
Distance from well site: 260 km
Download the report for a full oiling analysis for Banks Peninsula and learn about the impact thresholds here: The Science
DOC, Banks Peninsula Marine Mammal Sanctuary
Distance from well site: 90 km
Download the report for a full oiling analysis for Oamaru and learn about the impact thresholds here: The Science
Distance from well site: 50 km
Download the report for a full oiling analysis for Taiaroa Head and learn about the impact thresholds here: The Science
Distance from well site: 620 km
Download the report for a full oiling analysis for Bounty Islands and learn about the impact thresholds here: The Science
DOC, Bounty Islands
Distance from well site: 960 km
Download the report for a full oiling analysis for Chatham Islands and learn about the impact thresholds here: The Science
BirdLife International
Well depth below sea: 1500 m
Permit: Deepwater Taranaki Permit (PEP 38451)
Permit operator: Anadarko NZ Taranaki Company
Permit owners: Anadarko NZ Taranaki Company (54%); Hyundai Hysco Co., Ltd. (36%), Global Resource Holdings, LLLP (5%), Randall C. Thompson, LLC (5%)
Well depth below sea: 1070 m
Permit: Canterbury Basin Permit (PEP 38264)
Permit operator: Anadarko NZ Taranaki Company
Permit owners: Anadarko New Zealand Company (50%), Origin Energy Resources NZ Limited (50%)
We are sorry this interactive map is not available for small devices. Please make sure to visit this web site on a tablet or personal computer for the full experience.
INDUSTRY standard numerical modelling techniques were used for the oil spill trajectory analysis in order to analyse the extent of oil propagation, dispersion and beaching in the event of a deep water at the Romney prospect in the North Island and the Caravel prospect in the South Island.
The numerical model is driven by a global database of meteorological and oceanographic conditions (waves, winds and tide) and reproduces the dispersion of thousands of oil spills during a variety of environmental conditions and scenarios over ten years of data.
With the database of spill trajectories (Fig. 1) generated using this approach we can perform impact assessments, oiling analysis and response time analysis.
Learn more about the methodology and the presented scenario below or download the full technical report or short summaries for both sites here:
For real world spills like the Rena shipwreck two years ago, deterministic models are used. These models use marine weather forecasts to predict the fate of the spilled oil in real time. For the possible impact of a hypothetical oil spill as shown in this website, probabilistic models are used instead. Probabilistic models run many hundreds or thousands of spill trajectories (see Figures 1 and 2 for a single trajectory) across multiple years of historic marine weather data.
The probability maps are then created from this database of spill trajectories. In the maps, the probabilities correspond to the percentage of the modelled trajectories that exceeded a certain threshold of oil thickness for a given location. This impact threshold or "level of concern" varies for different types of socio-economic or ecological resources of interest.
The impact analysis scenario presented on this website for the Deepwater Taranaki and Canterbury Basin permits are based on the best information that was available at the time of writing the report.
A relief rig capable of deep sea drilling must be contracted to drill a relief well and stop the blowout. In the best case scenario a rig will only have to travel from Australia or New Guinea (we estimated 23 days to contract and relocate a suitable rig). The 53 days required to drill a relief well in our scenario is potentially an underestimate, as it is based on a previous shallow water relief well operations at the Montara well, in the Sea of Timor.
In an area where little or no drilling has taken place, it is virtually impossible to predict what the flow rate of hydrocarbons from a reservoir may be. No industry experts were willing to provide information about what flow rates are expected at the Deepwater Taranaki and Canterbury permit areas. In Taranaki, the Maari oil field has been documented as having wells with natural flow rates of 10,000 bbl/day of crude oil (through a choke of 26%; NZPAM, 2009). Based on this information, we have therefore assumed a worst case scenario of a flow rate of 10,000 bbl/day. A deep sea well needs a high flow rate to be economic, especially given the cost of running a production platform that is specialised for the deep sea environment. Therefore the rate that we have shown may even be an under-estimate of the flow rate that operators are hoping to encounter.
Before drilling commences an unexplored area, there is uncertainty about the state that hydrocarbons will be in (i.e. gas, condensate or oil). Statements have been made in the media that both the Romney prospect in Taranaki and the Caravel prospect in Canterbury may contain oil. We therefore modelled a medium crude and we verified that this had properties similar to known oil types in Taranaki.
For the website probability maps, we present the results of trajectories modelled during the summer season only, as this is when Anadarko will likely be drilling (see the full report for the winter analyses). The probability maps were therefore based on the 500 trajectories simulated during the summer season. Using 500 trajectories gives less smooth impact probability contours compared to using more trajectories, but does not change the overall results (see page 27 of the full report for further details).
The level of concern refers to the minimum threshold of oil density shown in the probability maps. We established a minimum level of concern of 1 g/m2 based on the socio-economic impacts at sea and on land that have been defined by National Oceanic and Atmospheric Agency (NOAA) of the United States of America (2013).
The oil spill modelling tools used in this study are public domain software available from NOAA. This includes the General NOAA Oil Modelling Environment (GNOME, Beegle-Krause J., 2001) and the Trajectory Analysis Planner (TAP). A spill was represented by 10,000 Lagrangian elements or particles. The particles’ motion was driven by three main components: oceanic currents, wind and a random diffusion factor set of 100,000 cm2/s.
Sea surface currents were extracted from the Global Hybrid Coordinate Ocean Model (Global HYCOM) (Chassignet, et al., 2007). The currents (shown in figure 3) are forced by the US Navy’s Operational Global Atmospheric Prediction System (NOGAPS) which includes wind stress, wind speed, heat flux, and precipitation. The model provides systematic archiving of daily three-dimensional ocean circulation on a global scale with output data archived back to 2003.
The sea surface wind data used in the model came from the NCEP/NCAR global reanalysis (Kalnay, 1996) provided by NOAA/OAR/ESRL PSD.
Previous studies have shown that oil tends to spread out in the direction of the wind by typically about 3% of the wind speed (Stolzenbach, et al. 1977). The wind roses in figure 4 show the typical wind speed and direction in the areas that were modelled.
Learn more about the methodology and the presented scenario below or download the full technical report or short summaries for both sites here:
We are sorry, your system does not support the fully interactive version of this map.
Please use a modern browser on a desktop computer for the full experience, or continue to the limited, (but still richly informative) version of this map.